Impervious surfaces vs green areas, but also the interplay of demographic, socioeconomic and built environment factors, all influence heat-related impacts and risks in urban contexts. A risk assessment analysis led by CMCC on the heat-health nexus in the city of Turin has been developed with the highest resolution possible by considering driving forces behind inequalities. The outcome of the research provides insights for local policymakers in the definition of medium and long future adaptation measures to implement at the local scale.
Urban areas are where the majority of the world’s population lives, and they are also usually most affected by climate change. Heat waves and extreme temperatures are more intense in heavily-built areas, intensifying existing weaknesses and inequalities among the urban population.
An interdisciplinary study published in the Urban Climate journal and led by the CMCC Foundation focuses on the Urban Heat Island phenomenon, providing a reproducible and flexible methodology to explore the risk assessment on the heat-health nexus within the city of Turin, Italy.
The Urban Heat Island (UHI) is defined as a temperature difference between urban and rural areas, caused by the excess of heat emitted and by the solar gain trapped by the urbanized environment. “The UHI phenomenon is typical of urban areas and it is stronger during heat waves events,” said Marta Ellena, of the CMCC’s REgional Models and geo-Hydrological Impacts (REMHI) division, and first author of the paper. “This happens because cities are mostly covered by impermeable surfaces, and this makes temperatures higher, worsening the already existing UHI effect.”
The main objective of the study was to produce climate risk assessment evaluations at the local scale taking under consideration the main drivers of inequality, which are crucial for suggesting adaptation strategies for more climate-resilient and sustainable cities.
An important feature of the study was the identification of the UHI risk per census tract, which is the minimum geographical entity of data collection currently available from Italian municipalities. “This is one of the most innovative aspects of this work,” said Ellena, “because previous studies considered city’s quarters or districts. For example, Turin has 23 quarters and 8 districts: in this study we considered its census tracts, which are 3843, so it is an enormous set of information, especially compared to previous studies.”
The research was carried out adopting an up-to-date theoretical framework proposed by the Intergovernmental Panel on Climate Change (IPCC), and applying it on the urban area of Turin, the fourth most populated Italian urban area.
The UHI-related risk is described in this framework as a combination and interaction of three main factors: hazard, exposure, and vulnerability.
The climate hazard is represented by the UHIs and their distribution within the city boundaries; exposure refers to the presence of vulnerable citizens in urban areas who are likely to be adversely affected by the occurrence of UHI phenomena: in this case, the population aged 65 or over. Finally, vulnerability is defined as made up of two factors, sensitivity and adaptive capacity. Sensitivity is composed of the elements which contribute to the susceptibility of the exposed population considered, such as demographic and socioeconomic factors, health conditions and the environmental context of the urbanized area. Adaptive capacity, on the other hand, takes into consideration the availability of facilities and services which contribute to more favorable conditions for individuals under extreme temperatures.
“The combination of all these different factors allows us to express the complexity of the concept of risk associated with Urban Heat Islands,” said Guglielmo Ricciardi, of CMCC and Politecnico di Torino, another author of the study. “It’s not only greener or more urbanized areas that influence the risk on citizens. We should also consider the characteristics of buildings, the proximity to hospitals, or to public spaces with air conditioning, among others.”
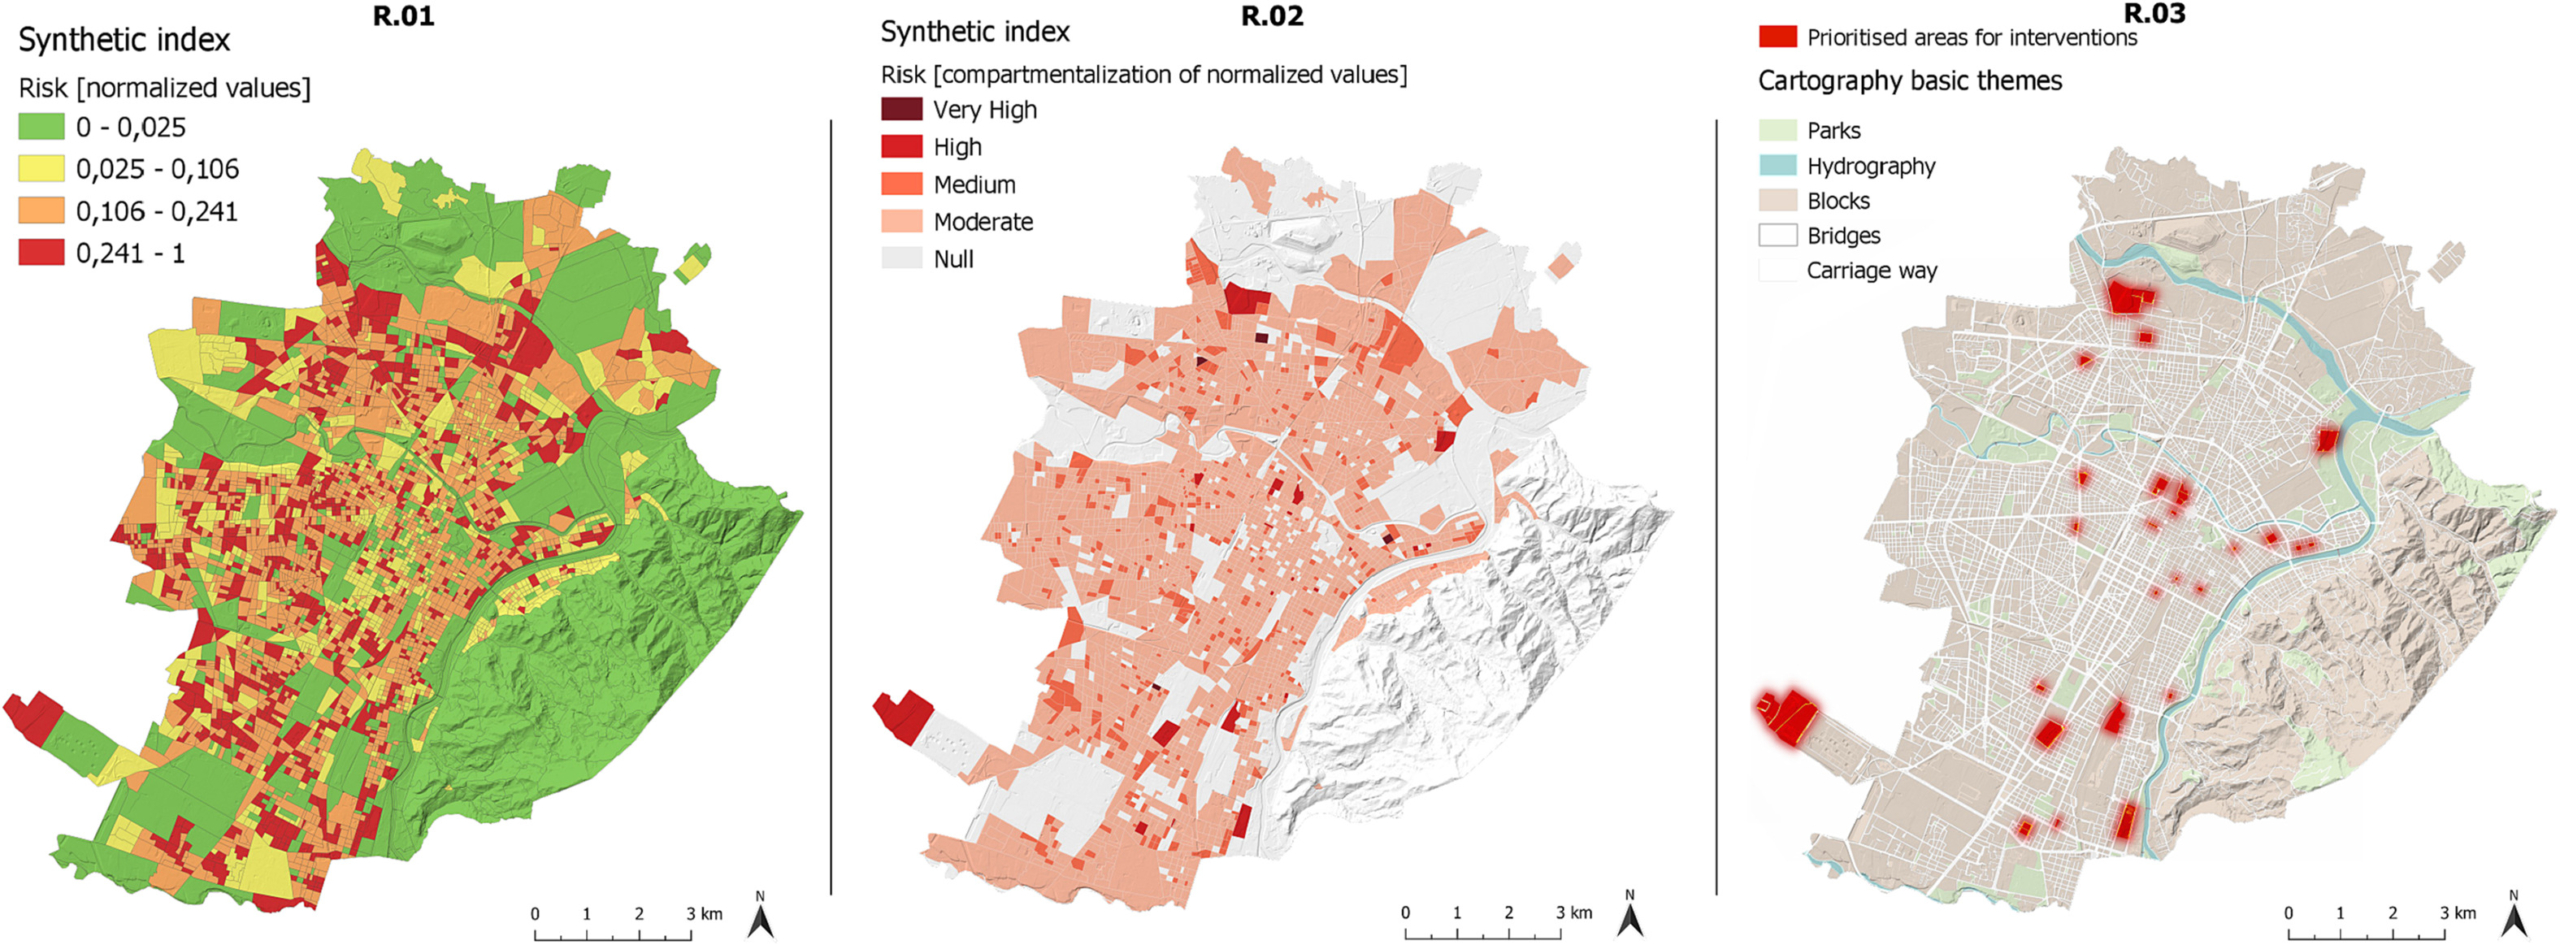
The results were collected in tables and visualized through georeferenced maps for individual and aggregated indicators, and are open access and available under a creative commons license.

Mapping the UHI risks (R.01; R.02) and the prioritized areas for intervention (R.03).
The results of the study allowed for the identification of UHIs in the city of Turin, and the associated risk for the population, as well as the priority areas for intervention on a highly detailed scale. While the lowest hazard was measured in green areas corresponding with the main urban parks, thus demonstrating the significant contribution of vegetation to heat reduction, higher-risk zones are mostly located in the densely populated areas of the suburbs.
“A strength of this work is that such a high-resolution analysis of the connection between the UHI hazard, the population exposure, and the related vulnerabilities at the urban level is still uncommon,” said Ellena, “and we hope it will be used by policymakers for informed decisions and adaptation measures, or by other researchers as a guidance to reproduce similar analyses in other Italian (and not Italian) urban contexts”.
More information:


